every.farm CLEREL Crop Diversification
We recommend reading this statement before reading the report. A short note from Nick framing the work.

Loading statement…

Cornell AgriTech Cyber-Agricultural Intelligence and Robotics Laboratory NASA Acres every.farm
CLEREL · CAIR Lab · NASA Acres · Every.Farm

Agent-based crop diversification decision support, tested at CLEREL.

We are building an agentic workflow that pairs every.farm (farm context and remote sensing) and crops.every.farm (an audited crop catalog) with a Claude-orchestrated reasoning layer to help researchers and growers ask two questions at the field scale: which parts of my farm are best suited to diversification, and what should I plant there? Our first test case is the Cornell Lake Erie Research and Extension Laboratory (CLEREL) in Portland, NY.

Lab: Cyber-Agricultural Intelligence & Robotics (CAIR), Cornell AgriTech PI: Dr. Yu Jiang PhD lead: Nicholas Gunner Refresh: April 2026
9Diversification candidate zones identified at CLEREL (age-adjusted)
6.9 acTotal candidate acreage (~25% of vineyard)
5Mature seasons (2020+) used for fair comparison
32Audited crops scored against each pixel
0.30Candidate IoU vs open-data pipeline (was 0.52 pre-adjustment)

How to read this report. The narrative below explains the motivation, the system we are building, what we have produced at CLEREL so far, and how we plan to assess whether the recommendations are actually useful. Several sections are interactive — click the diagram nodes, drag the criterion sliders, or click any candidate zone on the map to drill in.

Motivation

Why crop diversification, and why now?

Specialty crop monocultures across the Lake Erie Grape Belt — Concord and a handful of vinifera and hybrid wine varietals — face compounding pressure from climate volatility, processor consolidation, and labor and input cost inflation. The economic case for adding complementary crops is increasingly clear, but the operational case is hard: which parts of which fields, with which crops, with what payback horizon?

March 2026 — a concrete example. Refresco, one of the major Concord grape processors serving the Lake Erie Grape Belt, abruptly canceled contracts with growers across western New York, Pennsylvania, and Ohio — after many had already invested in the 2026 season. Smaller-acreage growers who delivered only to Refresco face the steepest fall: no buyer, sunk costs, and a real possibility of mothballing vineyards to cut losses. The episode is a stark, recent illustration of the structural risk that motivates this work — that single-processor exposure on a single specialty crop can flip from steady to existential overnight.

Decision support for this question has historically meant a soils map, a yield monitor printout, and a conversation with an extension agent. That works, but it does not scale, it can’t easily integrate the full open-data toolbox of remote sensing and climate records, and it can’t cheaply re-run as new imagery arrives, prices move, or the catalog of viable crops grows.

Our hypothesis is that an agent-based workflow, built on top of well-defined APIs for farm context and crop intelligence, can give researchers and growers a faster, more auditable, and continuously-updateable starting point for these conversations — without replacing the expert review and on-farm trials that ultimately validate any recommendation.

The two research questions the system aims to answer:
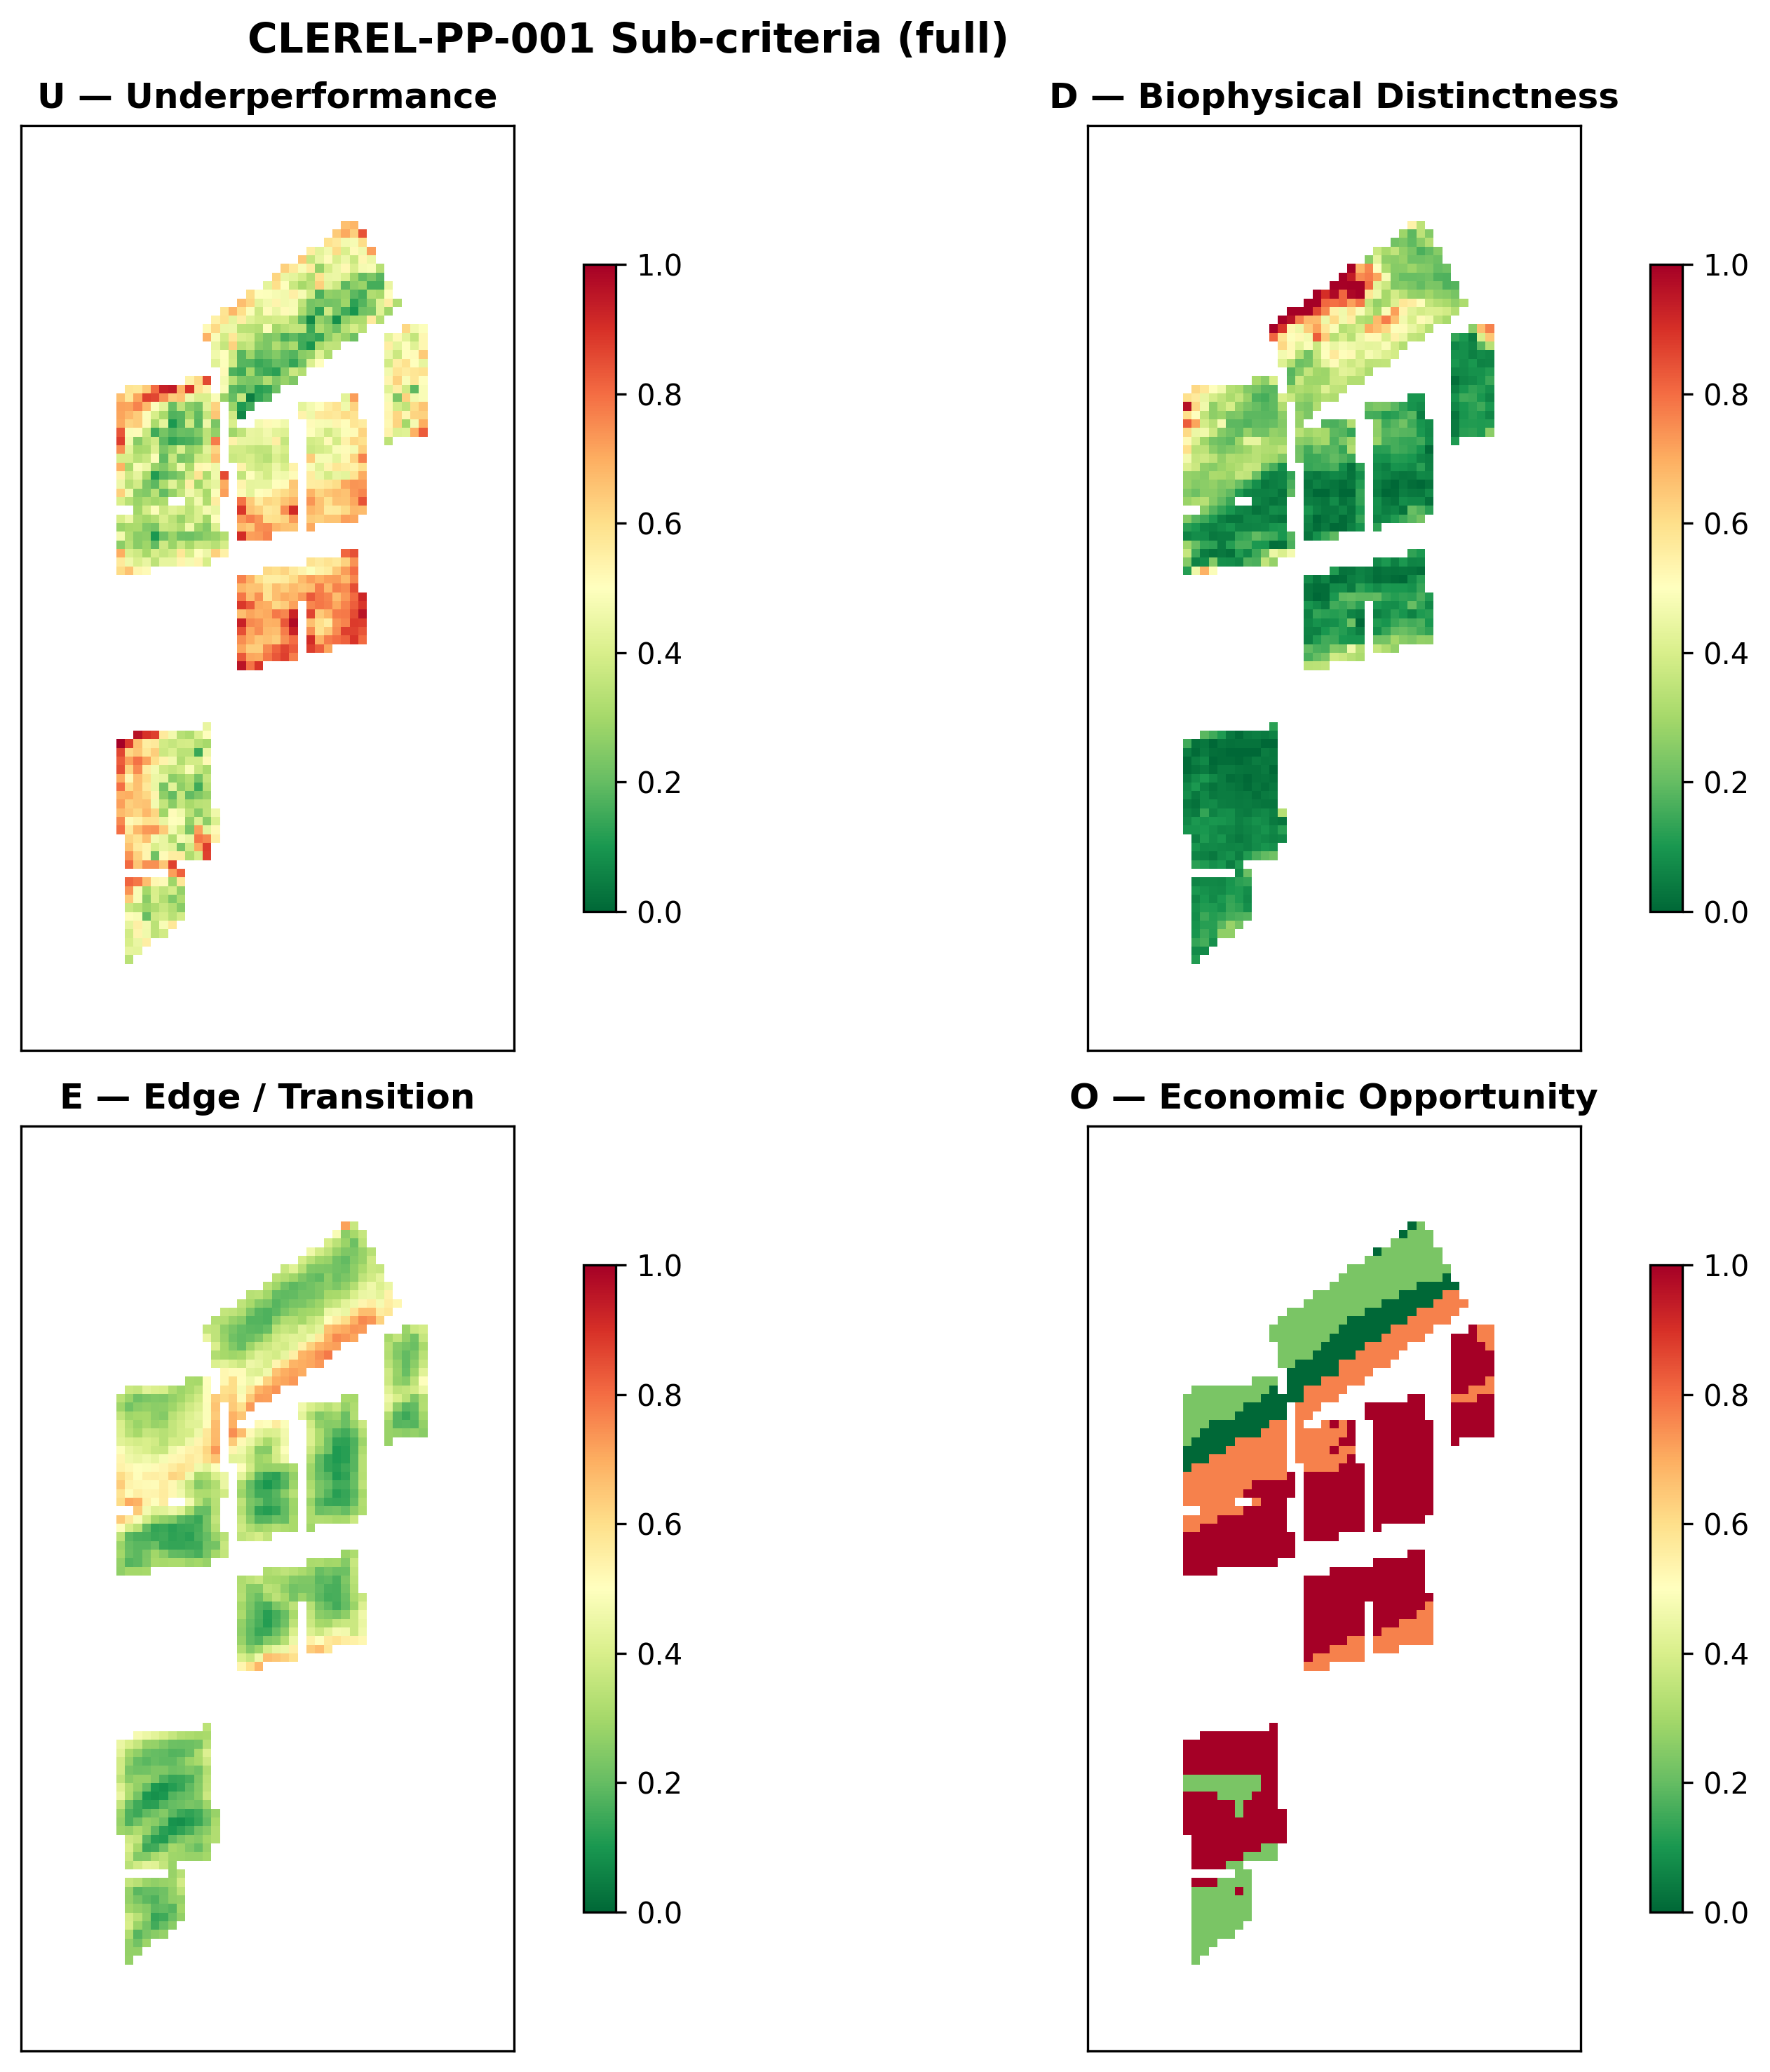
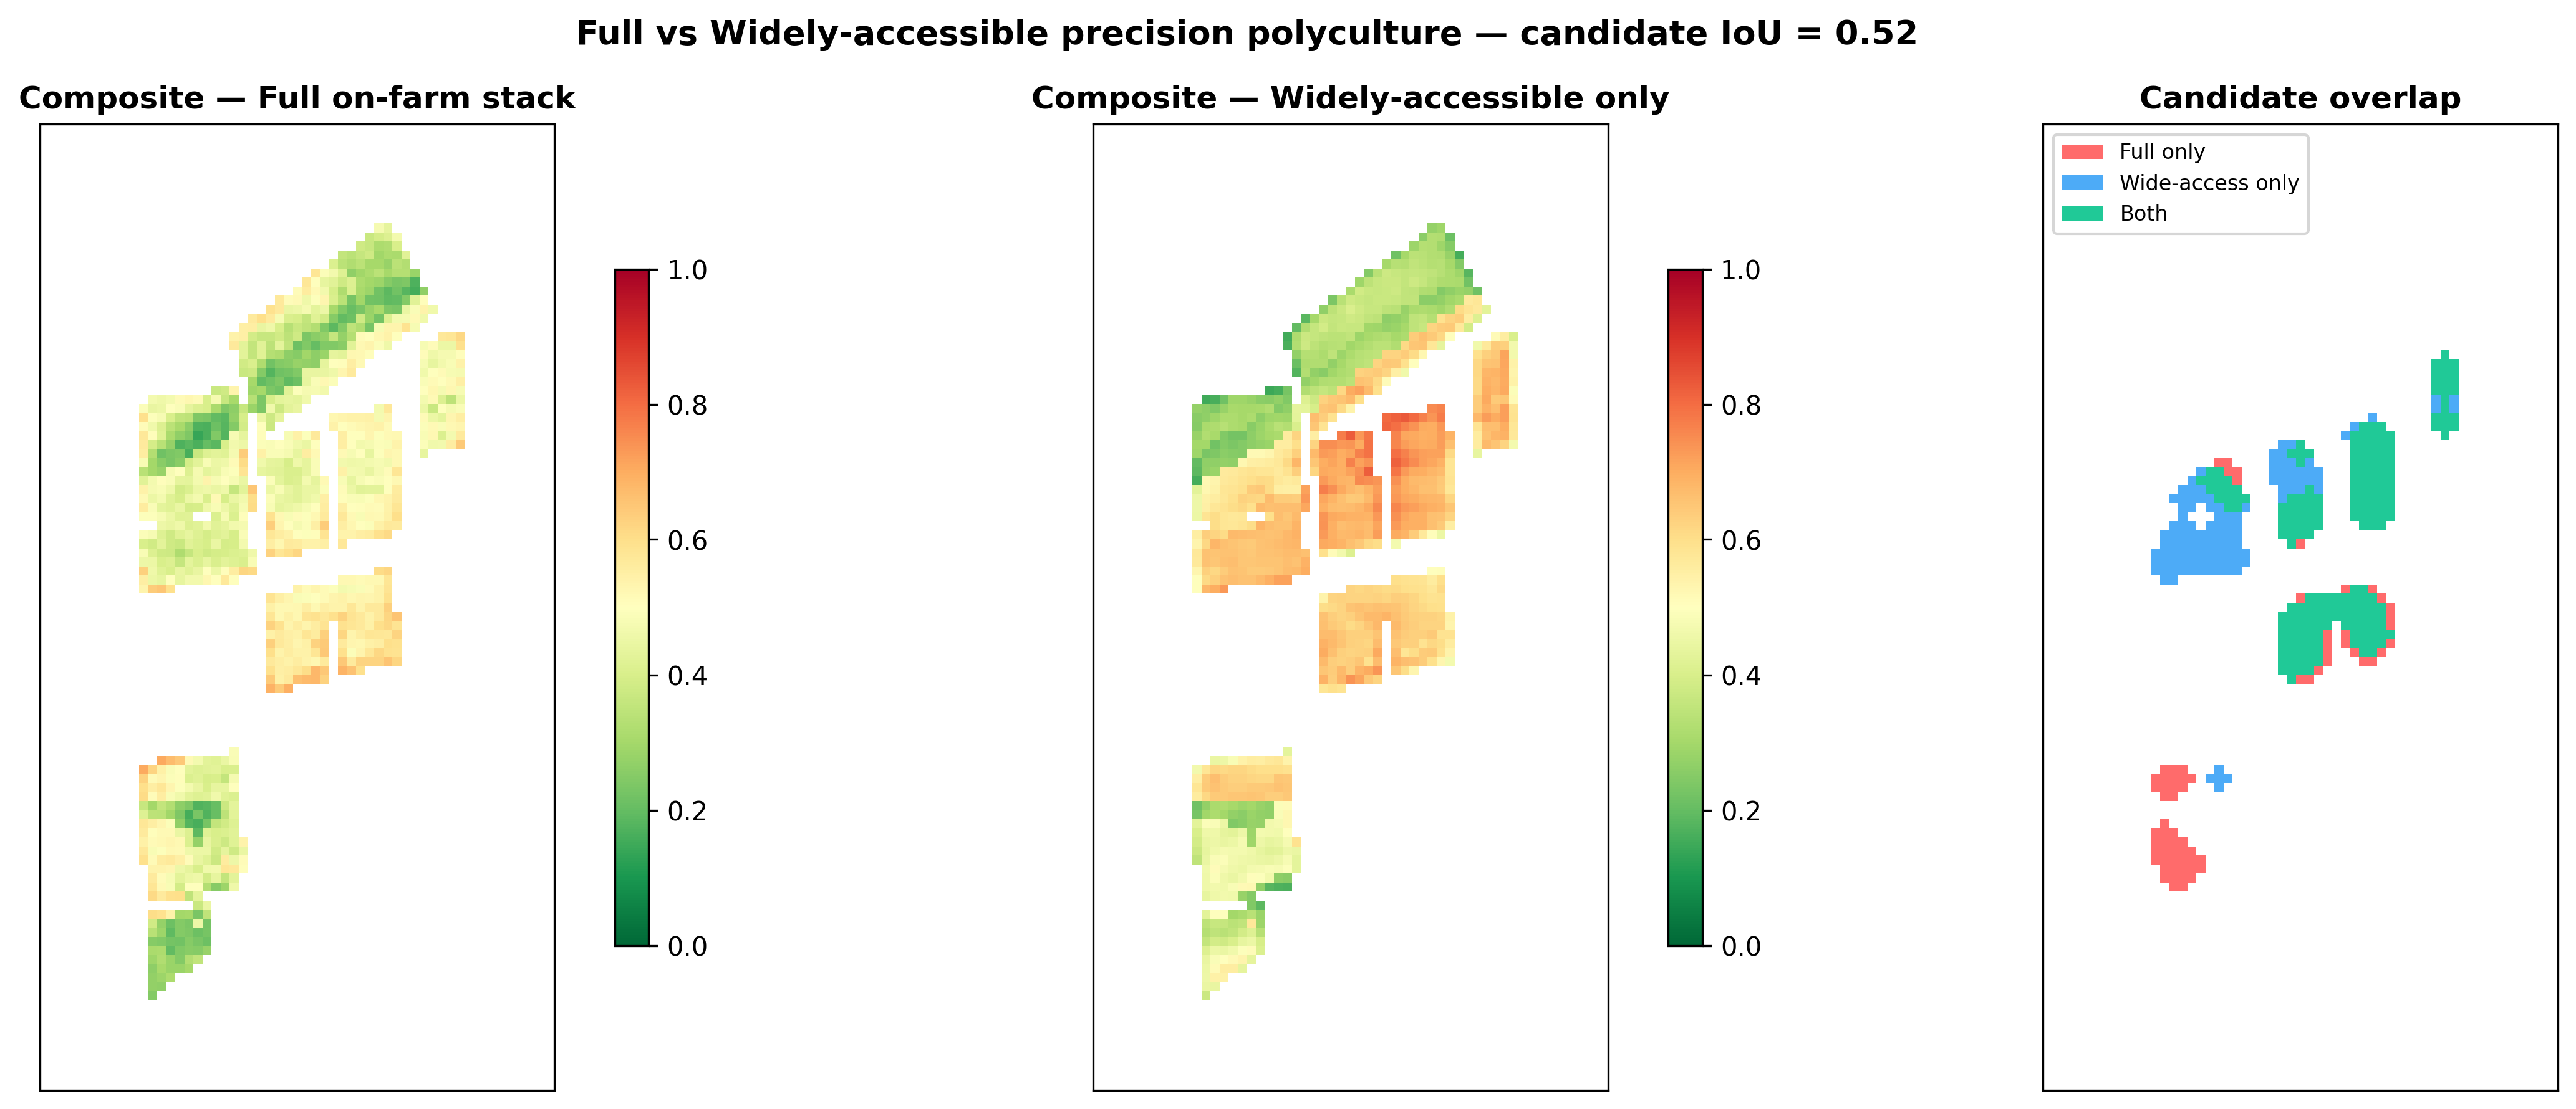
1. Identify candidate geographies — the sub-field regions where diversification is most justified by underperformance, biophysical distinctness, edge/transition character, and economic opportunity.
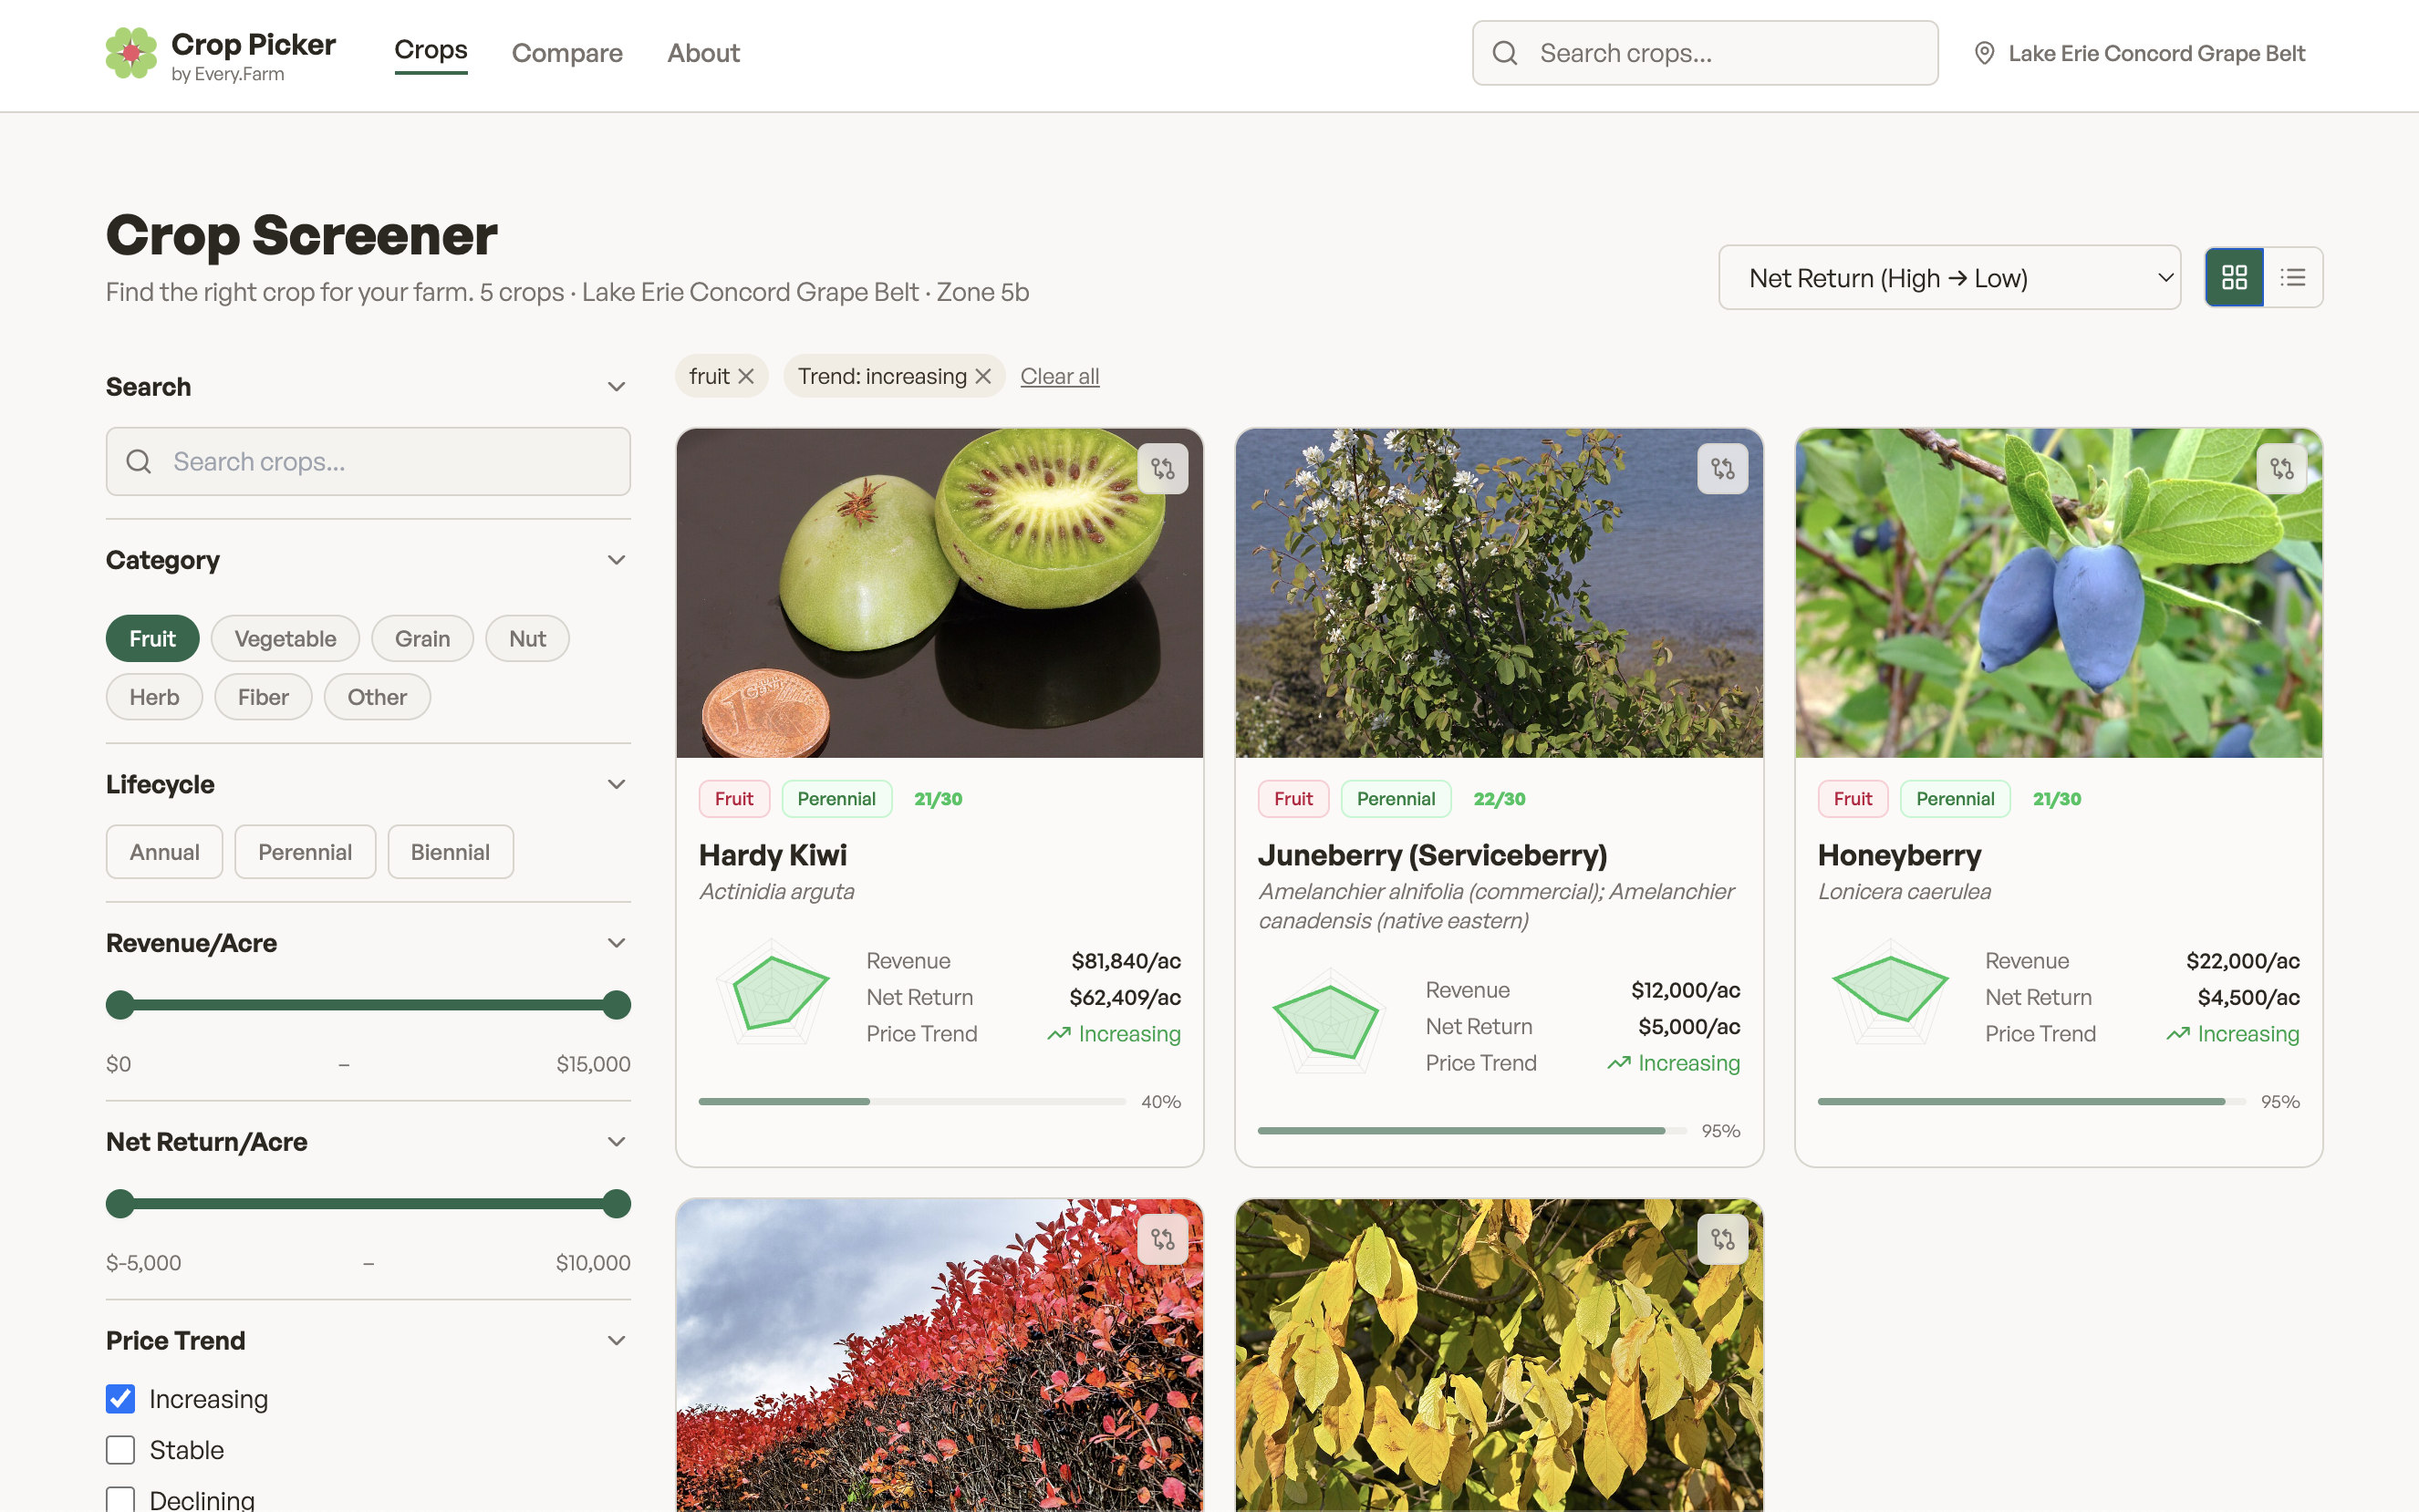
2. Identify candidate crops — the audited catalog entries that match each region’s soil, drainage, climate, and market context, ranked for fit and economic upside.

The system

An agent that reasons over farm context and crop intelligence.

Click any node in the diagram to expand its role in the pipeline.

every.farm Farm context · block boundaries Remote sensing ingestion crops.every.farm Audited crop catalog Market · climate · risk · infra Agent-based system (Claude) Pixel-level scoring Per-zone crop matching Decision support Candidate zones Ranked crop shortlist API API

Click a node above to read more.

Components built

What works today.

Three layers of the system are in production. The agent layer is operational and currently being exercised against CLEREL.

every.farm

Remote sensing ingestion

Browse, retrieve, and aggregate open imagery and gridded climate data into per-block time series. Twelve open datasets are wired in today, covering optical, radar, soils, terrain, climate, and land cover.

  • Sentinel-2 L2A
  • Sentinel-1 SAR
  • Landsat 8/9 L2
  • MODIS
  • USDA NAIP
  • Daymet
  • gNATSGO Soils
  • USGS DEM
  • ESA WorldCover
  • NASA HLS Landsat
  • NASA HLS Sentinel
  • Impact Observatory LC

Open archives only — easy time-series aggregation per block, including pixel statistics over arbitrary date ranges.

crops.every.farm

Audited crop catalog

A curated, continuously-audited catalog of crops appropriate for U.S. growing regions. The April 2026 audit refreshed prices and added per-crop suitability matrices for soil texture and drainage class, alongside a 5-axis “snowflake” regional fit score. The catalog is still actively growing.

Crops in catalog (live)
Plotted in chart below
Highest regional fit

Full schema: pH range, GDD, frost-free days, water requirement, years to production, gross/net return, price trend, insurance availability, snowflake axes (market · climate · infrastructure · financial · risk).

Agent layer

Claude-orchestrated scoring

The agent assembles raster stacks from every.farm, computes per-pixel sub-criteria (Underperformance, Distinctness, Edge, Opportunity), segments candidate zones, and queries the catalog with each zone’s biophysical profile to surface a ranked crop shortlist. Each step is reproducible; provenance is preserved end-to-end.

  • Per-pixel score on a 10 m grid
  • Robust statistics (Mahalanobis, MCD)
  • Texture & drainage suitability lookup
  • Audit trail per recommendation

every.farm in practice

Block-aware imagery search, time-series aggregation, and field-data capture from one workspace.

every.farm screenshot showing block-level NDVI analysis with mobile field capture

Field NDVI distribution and per-block analysis on the desktop, paired with a mobile capture flow for in-situ measurements.

crops.every.farm: the Crop Picker

A grower-facing screener over the audited catalog, filterable by region, lifecycle, category, revenue, and price trend.

Crop Picker screener showing fruit perennials with increasing price trend in the Lake Erie Concord Grape Belt

Crop Picker by Every.Farm — filtered to fruit / perennial / increasing-price-trend in the Lake Erie Concord Grape Belt.

Catalog explorer — live snapshot of crops.every.farm

Hover any point to see crop details. Position is regional fit (snowflake total) versus net return per acre.

The dashed green line is the Pareto frontier: the set of crops where no other crop in the catalog has both higher regional fit and higher net return. Crops on the frontier (haloed in green) are the candidates a rational grower could not strictly improve on without trading off one axis against the other. Crops below it are dominated — there is at least one crop with both better fit and better return.

Note that the snowflake score is a regional-fit composite (market, climate, infrastructure, financial, and risk) rather than a fit to any specific field. The pipeline composes this regional confidence with per-pixel suitability matching to produce per-zone recommendations. The chart filters to crops with snowflake ≥ 12 and a positive net return; lower-fit or unaudited crops are still in the catalog but not plotted here. The CLEREL analysis below was run against the April 2026 catalog snapshot (32 crops with both fields populated); the current live catalog is larger and a re-run would incorporate the new entries.

Initial CLEREL results · age-adjusted

Nine candidate diversification zones, mapped and matched.

A composite score combines four sub-criteria: Underperformance (U), Biophysical Distinctness (D), Edge/Transition (E), and Economic Opportunity (O). Pixels above the 70th percentile within the vineyard are smoothed and segmented into candidate zones (PPZs), then matched against the catalog. Click any zone on the map below to inspect it.

Assessment update — April 30, 2026. Dr. Terry Bates (CLEREL) flagged that the previous top zones (Joy/Martin and the Taft East cluster) sit on blocks planted in 2014–2015. Vines that young hadn’t reached full production for much of the 12-season yield window, which inflated their U residual against mature varietal peers. We re-ran the pipeline with two corrections: (1) drop establishment-phase rows (vine age < 5 yrs) per block, and (2) restrict the comparison to the 2020+ common window when every block — young or mature — was producing. After adjustment, the 2.59-acre Joy/Martin zone that was the headline finding disappears entirely; the new top zones sit on Railroad Block, with Barn Block close behind. The young-vine blocks now appear at ranks #4, #8, #9 with much smaller polygons. This is a real example of expert review changing the conclusion — and a reminder that vine planting age is a piece of context the satellite-only pipeline cannot recover from data alone.

Selected zone

Click any candidate zone on the map to drill in. The panel below updates with that zone’s biophysical context and top crop matches.

Click a zone to see its crop shortlist.
Try it

Re-weight the composite. Watch the ranking shift.

The four sub-criteria are combined into a single composite C with weights set during the experiment. There is no single correct weighting — yield-driven or market-driven framings shift which zones float to the top. Drag the sliders or pick a preset.

U · Underperformance12-yr yield residual + CV
0.35
D · Biophysical DistinctnessMahalanobis from vineyard median
0.25
E · Edge / TransitionBoundary proximity + TWI + slope
0.15
O · Economic OpportunityBest-crop net return − grape baseline
0.25

Weights are renormalized to sum to 1.

Live ranking

Top candidate zones.

Highlighted rows changed position relative to the previous weight setting.

Sub-criteria, one at a time

Each criterion picks out a different pattern at CLEREL. Tab through to read what each is doing.

Does this work without the on-farm data?

A second pipeline restricts inputs to widely-accessible layers only — Sentinel-2, USGS 3DEP, POLARIS, PRISM. After the age adjustment, the two pipelines agree on substantially fewer pixels.

Full versus widely-accessible candidate overlap
9Full-pipeline PPZs
6Open-data PPZs
0.30Candidate IoU (was 0.52 pre-adjustment)
12×Yield variance from ECa over satellite-only (CLEREL-MLF-001)

Interpretation: the IoU drop from 0.52 to 0.30 is itself the headline. Once the on-farm pipeline incorporates vine planting ages (a piece of context that lives only in human knowledge — not in any satellite, soil, or yield-monitor stack), it diverges from the satellite-only pipeline. The open-data baseline cannot see why a young Concord block is producing differently from a mature one. This sharpens the case for tiered service: an open-data baseline that flags general-shape candidates, plus a premium tier that ingests grower-supplied planting records and ECa surveys before producing recommendations.

Crop spotlight

Three candidates emerge. Hardy kiwi leads on expected value.

Querying crops.every.farm against the dominant CLEREL diversification zone profile (silt loam, moderate-to-well drainage, ~6.2 pH, Zone 6a), the same three crops surface across most zones.

Hardy kiwi at CLEREL — deep dive Top expected value

Why hardy kiwi keeps surfacing as the top expected-value pick at CLEREL, and what makes it interesting beyond the headline net return:

  • Local cultivar pedigree. The dominant cultivar ‘Geneva 3’ was developed at Cornell AgriTech (Dr. George Slate), giving CLEREL direct institutional knowledge of the crop.
  • Strong and growing market. Audited price trend is increasing; consumer demand for kiwiberry-style fresh fruit has been climbing for several seasons.
  • Familiar infrastructure. Trellis and training requirements overlap meaningfully with the existing grape system — capital-efficient to layer in.
  • Active research collaborator. The University of New Hampshire program is a useful peer for knowledge sharing on cultivars, training, and pest pressure.
  • Maturity gap. Fully ripe at 20–25 brix, but typically harvested at ~8 brix because it is climacteric and ripens off-vine — operationally simple harvest window.
  • Limited disease pressure. Fewer of the chronic disease challenges that drive grape input cost.
Caveat. The catalog’s $62,409/ac net return for hardy kiwi is at the optimistic end of current market data, and the crop is susceptible to late-spring frost — the same hazard that already shapes vineyard site selection. A grower-facing recommendation should always present the full top-3 shortlist (above) rather than a single pick, and any pilot would start with a small-area trial. The point of the system is to surface defensible candidates, not to prescribe.
Specific trial candidates · 2026-05-13

What to plant on the open lands at CLEREL.

Dr. Bates has opened the property’s non-vineyard lands for crop diversification trials. We ran a fresh per-block analysis on Poppies (near the road), Open Land (north of Joy Block), and Triangle Open Block (north-east corner of the property) using the new every.farm satellite API endpoints. All three blocks were profiled against the live 52-crop catalog and the top three trial candidates per block are below, with rationale tied to the actual block measurements.

Methodology in one paragraph. The new every.farm v1 satellite API computed temporal-mean NDVI and stddev (Sentinel-2 L2A) and VH backscatter (Sentinel-1 RTC) over the 2025 growing season for each block; results landed back in the CLEREL workspace as fresh vector datasets. Soil and terrain were sampled from the local POLARIS and 3DEP stacks across each block’s footprint. The combined site profile was scored against the audited crops.every.farm v3 catalog using the same agentic scoring function as the precision-polyculture pipeline. The resulting top-3 shortlist per block was written back to the farm via POST /v1/farms/:id/datasets — it is now a live, queryable layer alongside any other dataset in every.farm (dataset id 8csMLWnCx8AQybIfQ1q2, 3 features).
Block 1 · road-side

Poppies 0.95 ac

South-edge block near the road. Already in pollinator-friendly poppy plantings; high public visibility makes this the natural home for trials that double as demonstration / agritourism.

NDVI mean (2025 growing season)0.715
NDVI intra-block stddev0.013→ very uniform canopy across the block
Sentinel-1 VH backscatter−17.99 dB→ relatively dry soil signature
Soil pH5.29→ moderately acidic, favours ericaceous + small-fruit crops
Soil textureLoam (10% clay · 41% sand · 0.5% OM)
DrainageWell-drained
Slope · elevation1.0° · 234 m
Block 2 · interior

Open Land 1.6 ac

North-of-Joy-Block parcel — larger, more interior, less visible from the road. Suited to a research-oriented trial where agronomic answers matter more than public optics.

NDVI mean (2025 growing season)0.706
NDVI intra-block stddev0.0483.7× more spatial variability than Poppies
Sentinel-1 VH backscatter−15.80 dB+2.2 dB wetter signature than Poppies
Soil pH5.29
Soil textureLoam (10% clay · 40% sand · 0.5% OM)
DrainageWell-drained
Slope · elevation0.4° · 226 m

Top 3 trial candidates

#1 · fit 66/100
Aronia Berry
Aronia melanocarpa · fruit · perennial
$3,500/ac
net return · ↑ trend

Why here: the higher intra-block NDVI variability suggests heterogeneous moisture pockets — aronia tolerates a wide drainage band (well-drained to somewhat-poorly-drained both rate suitable+ in the catalog), which makes it the most forgiving lead candidate for a variable site. The 1.6 ac scale also supports a meaningful planting density (≈800 shrubs at 7×4 ft spacing) for an actual yield trial.

View on crops.every.farm
#2 · fit 62/100
Chestnut
Castanea spp. · nut · perennial
$3,363/ac
net return · ↑ trend

Why here: chestnut wants exactly this pH band (5.5–6.5 ideal), well-drained loam, and a long-term commitment that’s reasonable to make on a larger interior parcel. Slower payback (7–10 yr) than aronia, but the species fits the “open land” framing and gives an alternative woody perennial worth a side-by-side comparison.

View on crops.every.farm
#3 · fit 66/100
Buckwheat
Fagopyrum esculentum · grain · annual
$75/ac
net return · stable

Why here: an annual cover/cash crop that fills the gap while the perennial trials establish. Snowflake regional fit 28/30 — one of the strongest catalog scores. Buckwheat is also a tremendous pollinator forage, complementing CLEREL’s pollinator-habitat work. Use as a season-1 establishment cover between perennial rows or as a separate strip to compare flowering windows with the road-facing poppies.

View on crops.every.farm
Block 3 · north-east corner

Triangle Open Block 1.53 ac

North-east corner parcel, separated from the working vineyard. The largest and steepest of the three trial candidates, with the highest measured NDVI — suited to a native-tree commitment paired with an annual rotation that establishes faster.

NDVI mean (2025 growing season)0.742→ highest of the three blocks; healthy cover
NDVI intra-block stddev0.028→ moderately variable (between Poppies and Open Land)
Sentinel-1 VH backscatter−16.20 dB→ modest moisture, between the other two
Soil texture (defaulted)Silt loam · POLARIS no-data at centroid→ needs on-farm soil sample
Drainage (defaulted)Moderately well drained
Slope · elevation2.78° · 225 m3–7× steeper than the others

Top 3 trial candidates

#1 · fit 58/100
Aronia Berry
Aronia melanocarpa · fruit · perennial
$3,500/ac
net return · ↑ trend

Why here: aronia is the lead candidate across all three trial blocks, which makes it the natural anchor for a cross-block comparative trial — same crop, three sites, learn how each block performs relative to the others. Aronia tolerates the inferred silt-loam moderately-well-drained profile (ideal on both axes in the catalog) and handles modest slope. Snowflake regional fit 26/30.

View on crops.every.farm
#2 · fit 59/100
Black Walnut
Juglans nigra · nut · perennial
$1,500/ac
net return · stable · nut + timber

Why here: a native nut + high-value timber species comfortable on slopes (the 2.78° here is actually preferred over the near-flat conditions of the other two), tolerates a wide pH band, and is a long-term wealth play on a corner parcel that’s separated from vineyard operations. Snowflake 27/30 regional fit. The juglone allelopathy must be planned around — not a candidate for interplanting near anything sensitive.

View on crops.every.farm
#3 · fit 59/100
Winter Squash
Cucurbita maxima · vegetable · annual
$4,147/ac
net return · stable

Why here: snowflake regional fit 29/30 — the highest in the entire catalog. An annual cash crop that lets the block be productive from year one while the long-term perennials are evaluated. Sprawling habit covers ground quickly on the gentle north-facing slope; harvest is in the fall when the existing vineyard is also producing, so labour scheduling is familiar.

View on crops.every.farm

Live in every.farm. All three block footprints and their recommendation properties were written back to the CLEREL Facility workspace via the v1 dataset push endpoint and are now visible alongside any other layer on the farm. Dataset name: “Trial crop recommendations · Poppies + Open Land + Triangle (2026-05-13 v2).” Re-running the analysis on a future date will produce a new dataset rather than overwriting this one, so each round of recommendations is preserved.

Caveats & next steps. Poppies and Open Land share an essentially identical biophysical profile (loam · pH 5.29 · well-drained · 226–234 m); Triangle differs in two important ways — steeper slope (2.78°) and no POLARIS soil coverage at its centroid (the silt-loam / moderately-well-drained reading is a conservative default and should be replaced with a fresh on-farm soil sample before any planting decision). Open Land’s 3.7× higher NDVI variability and wetter S1 signature both suggest a within-block ECa survey before final layout. The catalog score doesn’t account for Cornell-specific cultivar availability (e.g. Hardy Kiwi’s Geneva 3 origin); Dr. Bates’ bench cultivars should be the final tiebreaker on any planting decision. Aronia anchors all three shortlists, which makes it a natural choice for a cross-block comparative trial — same crop, three sites.

What comes next

How we will know if these recommendations are actually any good.

An agentic system that produces beautiful maps is only useful if its recommendations hold up against expert review and on-farm reality. Our research plan is a structured loop between the model, the experts, and the field.

01

Improve workflows, models, and platforms

Sensitivity analysis on composite weights and segmentation thresholds; replace single-crop matching with polyculture-combination scoring; add per-zone NPV from establishment + operating cost when those fields are backfilled in the catalog.

Success: ranking robust to ±20% weight perturbations; combination recommendations validated by ag economists.
02

Expert assessment at CLEREL

Walk each candidate zone with viticulturists, soil scientists, and economists. Ask each reviewer: is this a defensible recommendation? Capture disagreements as structured feedback that re-enters the scoring function. Already underway: Dr. Terry Bates’ planting-age feedback prompted the age-adjusted re-run on this page.

Success: blind rater agreement >70% on top-ranked zones; disagreement traceable to specific layer choices.
03

Small initial crop trials

Pilot one or two of the top crops (likely hardy kiwi and a companion) on a sub-block of a high-scoring PPZ at CLEREL. Treat the trial as a measurement of the system, not just of the crop.

Success: trial outcomes (establishment, first-year yield, pest pressure) match model predictions within reasonable bounds.
04

Farmer, industry & consumer input

Beyond CLEREL, run structured interviews with Grape Belt growers, wholesale buyers, and processors to validate market assumptions. Surface the parts of the catalog where buyer proximity should down-weight a recommendation.

Success: market assumptions in catalog corroborated by >3 independent buyers per crop; buyer-proximity field operational.
05

Extension and outreach

Package the per-farm output into a deliverable that an extension agent can hand to a grower as a conversation starter — interactive map, per-zone shortlist, clear caveats. Iterate the format with extension staff.

Success: extension partners adopt the format for at least one farm visit; grower feedback collected in a structured channel.
06

Scale to the Grape Belt

Once the CLEREL loop closes, run the open-data pipeline against a sample of farms across NY and PA Grape Belt counties. Use the candidate-IoU between full and open-data pipelines as a calibration metric for service tiering.

Success: 20+ farms processed; open-data baseline plus optional ECa premium tier validated on adoption + value-add.

The big research question. Can an agent-based system, paired with well-defined APIs for farm context and crop intelligence, produce diversification recommendations that experts trust and growers act on? CLEREL — the Cornell Lake Erie Research and Extension Laboratory — is our first test case. The assessment loop above is the path to answering it credibly.